Show line chart
tip
neetbox.add_scalar sends a scalar to frontend display.
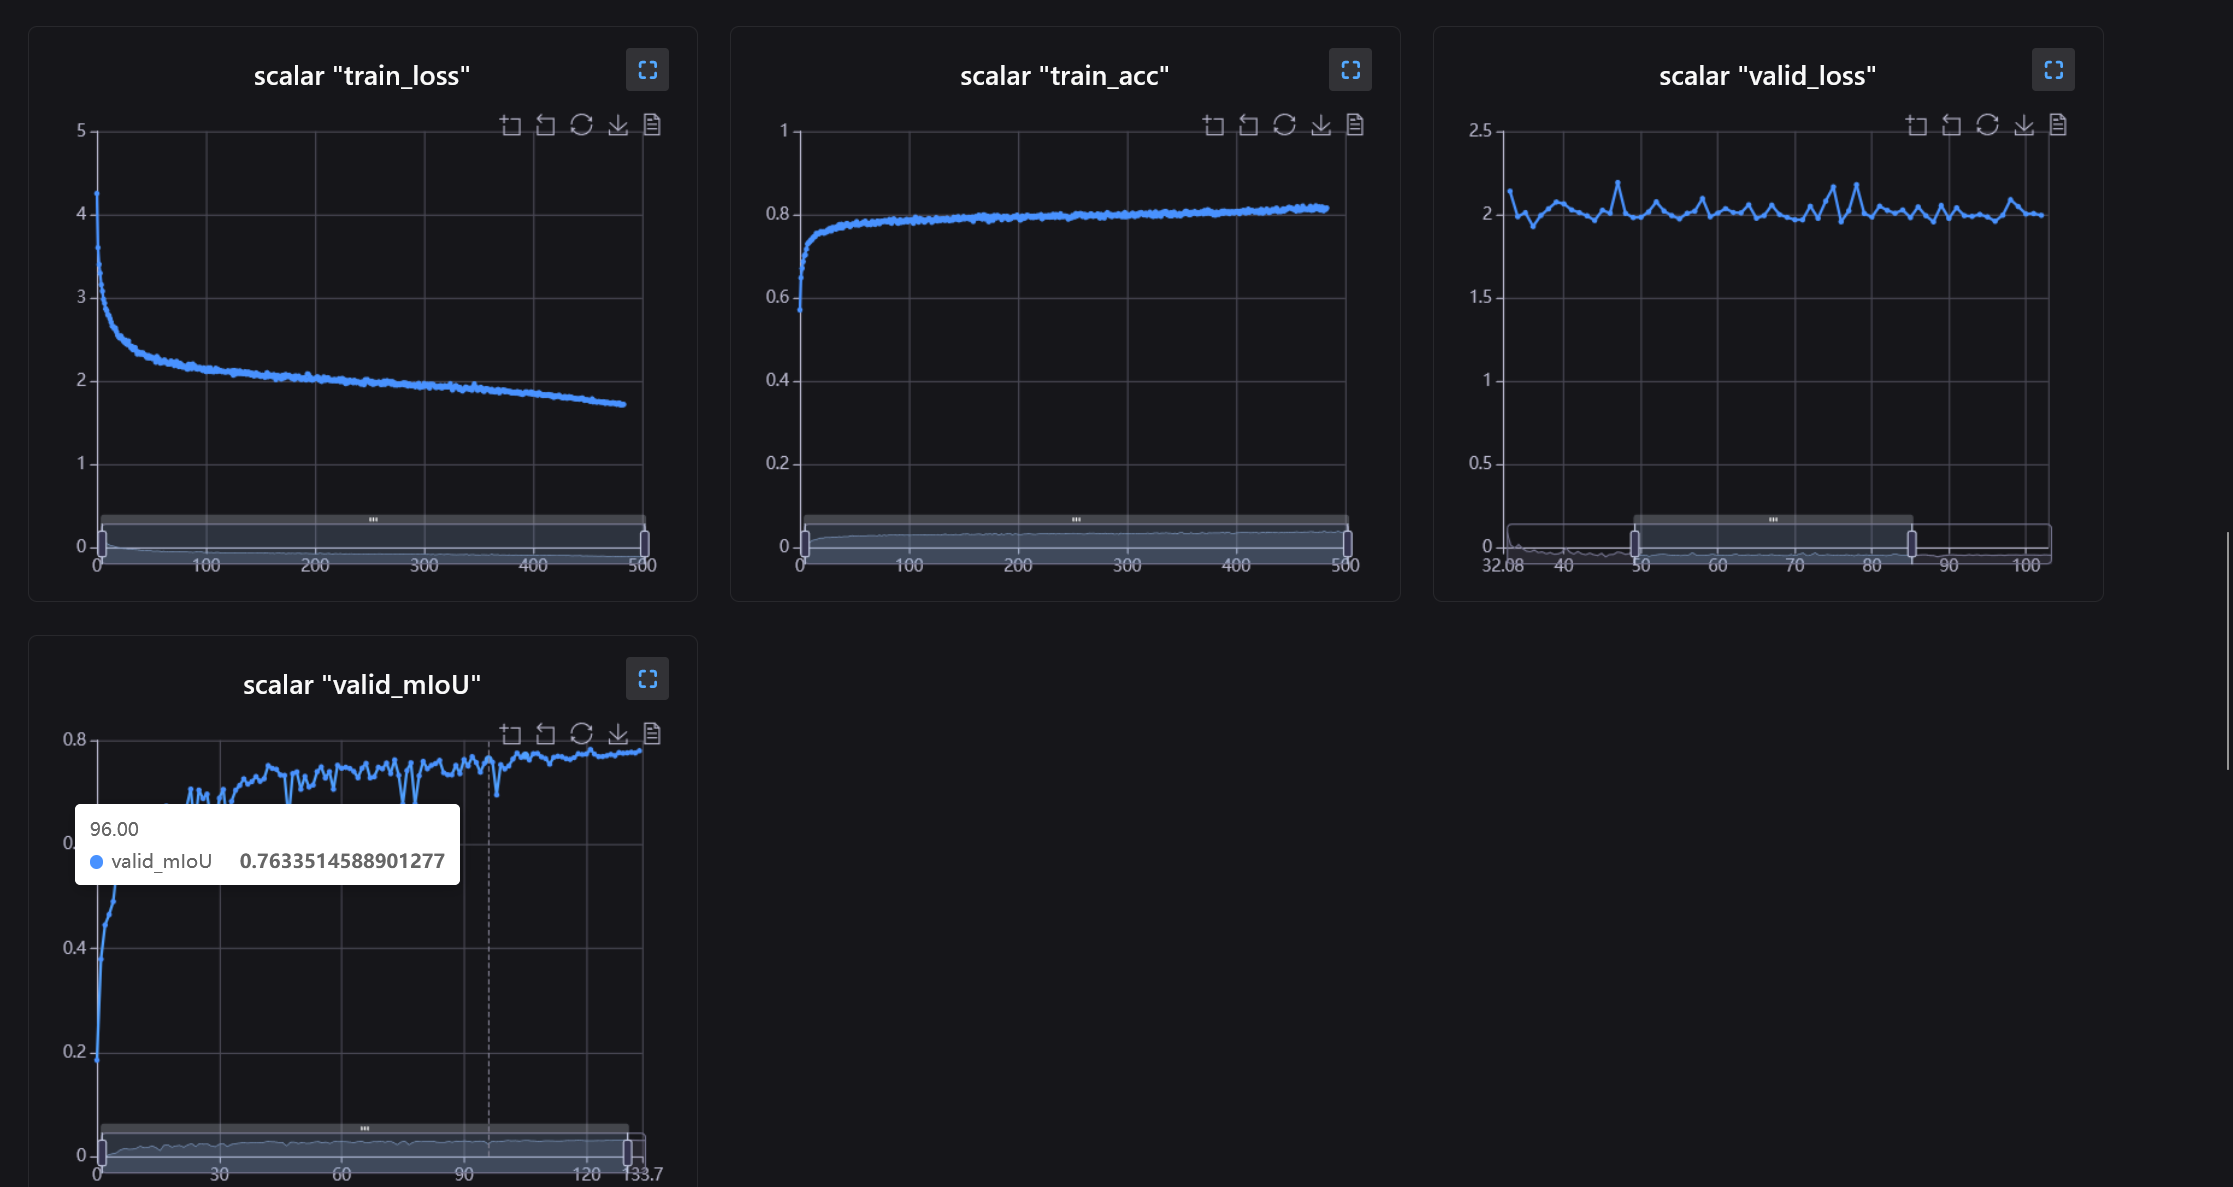
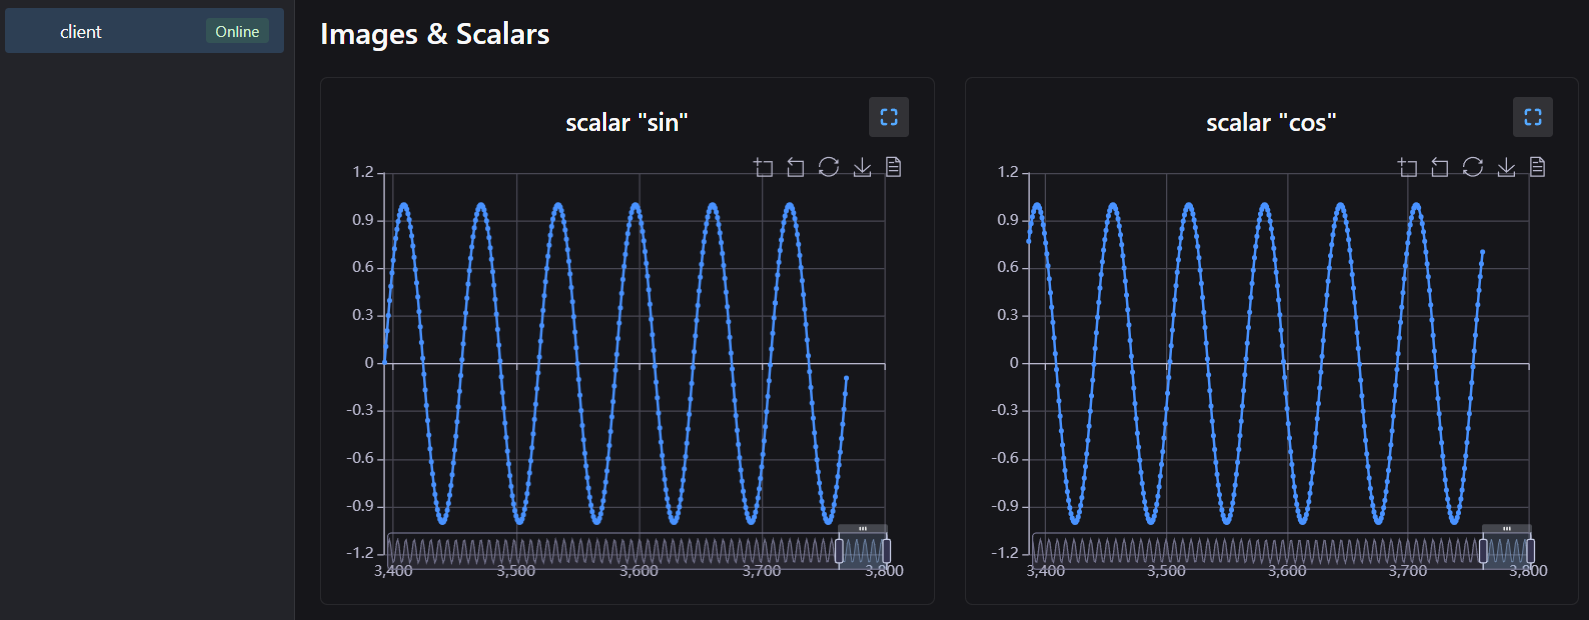
How it looks like
Basic Usage
import neetbox
import math
import time

for i in range(114514):
    time.sleep(1)
    neetbox.add_scalar("sin", i, math.sin(i * 0.1))
    neetbox.add_scalar("cos", i, math.cos(i * 0.1))
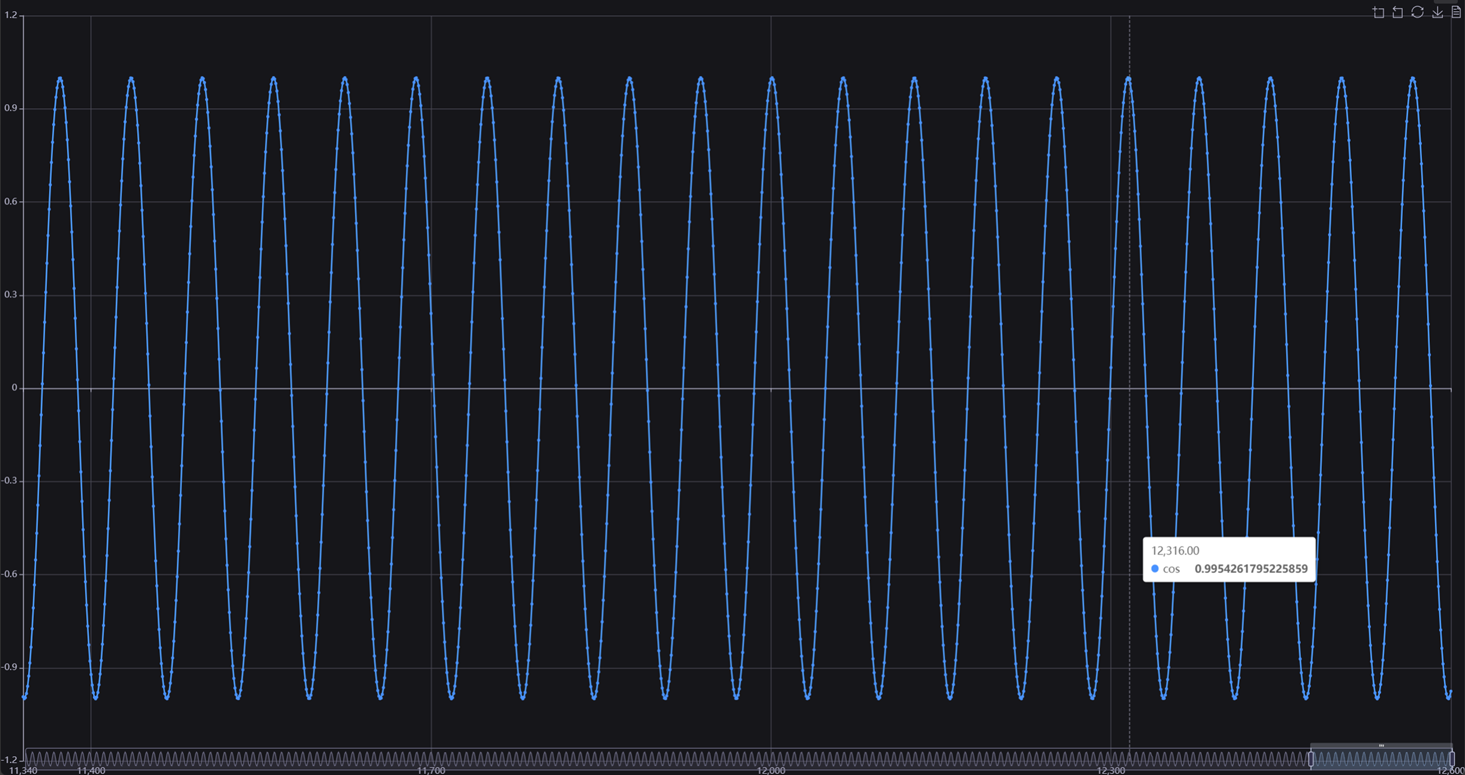
you can also zoom or magnify the chart in frontend:
API description
neetbox.add_scalar sends a scalar to frontend display.
def add_scalar(name: str, x: Union[int, float], y: Union[int, float])
Args:
- name (str): name of the image, used in frontend display
- x (Union[int, float]): x
- y (Union[int, float]): y